|
|
Revista de Educación Mediática y TIC 2025, 14 (1). ISSN 2254-0095 |

LA ENSEÑANZA DE LA COMPETENCIA DIGITAL EN GRECIA SEGÚN EL MARCO DIGCOMPEDU
TEACHING DIGITAL COMPETENCE IN GREECE ACCORDING TO DIGCOMPEDU FRAMEWORK
Vasileios Chondrogiannis1* & Juan Jesús Gutiérrez-Castillo2
1https://orcid.org/0000-0003-0277-9540; Ministerio de Educación de Grecia; Athens; Grecia; chondrogiannisvasileios@gmail.com
2https://orcid.org/0000-0002-3215-8959; Universidad de Sevilla; España; jjesusgc@us.es
*Autor de correspondencia: Vasileios Chondrogiannis, chondrogiannisvasileios@gmail.com
Recibido:09/10/2024 Aceptado: 18/11/2024 Publicado: 16/12/2024
Resumen: Durante la última década, en el ámbito de la educación se han introducido enfoques didácticos innovadores como consecuencia de la llegada de nuevos desarrollos tecnológicos. Éstos requieren un mayor desarrollo de la Competencia Digital Docente (CDD) que, en el caso de los países de la Unión Europea, ha sido regulada por el marco DigCompEdu. El objetivo del estudio es determinar y comparar el nivel de autopercepción de la Competencia Digital Docente (CDD) de los profesores en Grecia según el marco DigCompEdu. Participaron un total de 1420 profesores de todas las especialidades que imparten clases tanto en educación primaria como secundaria de diferentes regiones de Grecia.
Para ello, este artículo presenta los resultados de una investigación ex post facto con un diseño transversal, basado en un enfoque descriptivo y de comprobación de hipótesis. Además, el estudio examina la relación entre la competencia digital docente y una serie de factores, entre los que se incluyen las características demográficas de los profesores y su formación profesional (región de enseñanza, especialización, tiempo de uso de las TIC en el aula y nivel de educación primaria y secundaria).
Los resultados muestran que la mayoría de los participantes en la encuesta tenían un nivel medio o alto de TDC por especialidad. El factor género no resultó estar relacionado con el nivel de TDC. Además, el examen de los factores mencionados reveló resultados significativos que afectaban a áreas específicas de la competencia digital de los profesores. El presente estudio es uno de los primeros que se realizan en Grecia de acuerdo con la revisión más reciente del marco DigCompEdu y pretende contribuir a enriquecer aún más los datos disponibles sobre la CDT de los profesores de los centros de primaria y secundaria griegos.
Abstract: Over the past decade, in the field of education have been introduced innovative teaching approaches because of the advent of new technological developments. These require further development of Teaching Digital Competence (TDC) which in the case of European Union countries have been regulated by the DigCompEdu framework. The aim of the study is to determine and compare the level of teachers’ self-perception of Teaching Digital Competence (TDC) in Greece according to DigCompEdu framework. A total of 1420 teachers participated from all specialties that teach in both primary and secondary education from different regions of Greece.
For this purpose, this article presents the results of an ex post facto research with a cross sectional design, based on a descriptive and hypothesis testing approach. Additionally, the study examines the relationship between teaching digital competence and a number of factors, including the teachers' demographic characteristic and their professional background (region of teaching, specialization, time of use ICT in classroom and primary and secondary level of education).
The results show that the majority of the survey participants were found to have a medium to high level of TDC per specialty. The gender factor was not found to be related to the level of TDC. Furthermore, the examination of the aforementioned factors revealed significant findings affecting specific areas of teachers' digital competence. The present study is one of the first to be conducted in Greece according to the most recent revision of the DigCompEdu framework and seeks to contribute to further enrichment of the available data on the TDC of teachers in Greek primary and secondary schools.
Au cours de la dernière décennie, des approches pédagogiques innovantes ont été introduites dans le domaine de l’éducation suite à l’arrivée de nouveaux développements technologiques. Celles-ci nécessitent un développement ultérieur des compétences pédagogiques numériques (CDD) qui, dans le cas des pays de l'Union européenne, ont été réglementées par le cadre DigCompEdu. L'objectif de l'étude est de déterminer et de comparer le niveau d'auto-perception de la compétence numérique des enseignants (CDD) des enseignants en Grèce selon le cadre DigCompEdu. Au total, 1 420 enseignants de toutes les spécialités qui enseignent dans l'enseignement primaire et secondaire de différentes régions de Grèce y ont participé.
À cette fin, cet article présente les résultats d’une enquête ex post facto de conception transversale, basée sur une approche descriptive et de test d’hypothèses. En outre, l'étude examine la relation entre la compétence numérique des enseignants et une série de facteurs, notamment les caractéristiques démographiques des enseignants et leur formation professionnelle (région d'enseignement, spécialisation, durée d'utilisation des TIC en classe et niveau d'enseignement primaire et secondaire).
Les résultats montrent que la majorité des participants à l'enquête avaient un niveau de DBT moyen ou élevé par spécialité. Le facteur sexe ne s’est pas avéré lié au niveau de DBT. En outre, l'examen des facteurs susmentionnés a révélé des résultats significatifs affectant des domaines spécifiques de compétence numérique des enseignants. La présente étude est l'une des premières à être réalisée en Grèce selon la révision la plus récente du cadre DigCompEdu et vise à contribuer à enrichir davantage les données disponibles sur le CDT des enseignants des écoles primaires et secondaires grecques.
Palabras Clave: Competencia digital en la enseñanza; formación del profesorado; TIC; DigCompEdu
Key words: Digital competence in teaching; teachers training; ICT;DigCompEdu.
Mots clés : Compétence numérique dans l'enseignement; formation des enseignants; TIC; DigCompEdu.
INTRODUCTION
In an era marked by unprecedented technological developments, our world is undergoing a profound transformation that affects every aspect of people's lives. Technology has gradually changed the way we interact socially, communicate, learn, consume and spend our leisure time. In the field of education, it is imperative to explore the multifaceted ways in which technology reshapes the educational process. Teachers are an essential part of this process, so it is vital that they are equipped with the necessary skills such as Information and Communication Technologies (ICTs) competence for effective teaching in a digital environment. The acquisition of the "Teaching Digital Competence" (TDC) is an integral part of their professional development and has a strong impact on the effectiveness and quality of teaching. The term 'Teaching Digital Competence' (TDC) denotes the body of knowledge, abilities and/or skills related to digital technologies that are inherent to the role of a teacher (Ghomi & Redecker, 2019; Riquelme et al, 2022). These skills assist in the solution of various professional and pedagogical challenges encountered within the teaching profession. The digital competence of teachers must be modernized and harmonized with the ever-evolving digital world, always taking into account that it also depends on personal factors that determine it, such as gender, educational experience, specialization and age (Cattaneo et al. 2022).
The field of TDC has emerged as a significant area of research as evidenced by the growing amount of research published in academic journals and meta-analysis that focus exclusively on this topic (Şimşek & Ateş, 2022; López-Bouzas & Moral Pérez, 2022; Basilotta et al. 2022).
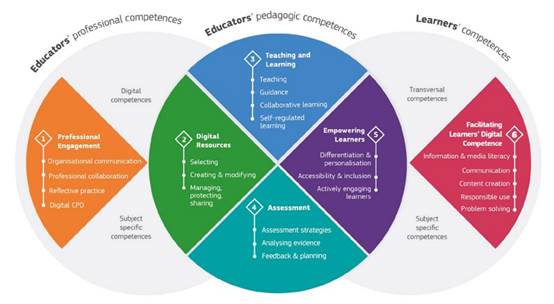
The challenge of digital education is global. In Europe, the European Commission perceived the need for an effort towards the creation of a coherent digital competence framework that could be used at all levels of education as a common reference point for all member states of the European Union. This was accomplished by the European Digital Competence Framework for Educators-DIGCOMPEDU, which provides a common language and understanding of the issues of digital competence of teachers and the dissemination of effective teaching practices. This framework aims to collate the digital competencies teachers’ need to acquire in order to effectively integrate digital technologies in their educational institutions while facilitating and encouraging the acquisition of such digital competences by their students. Designed for teachers at all levels of education, from early childhood to higher education, including general and vocational education and training, special education, adult education and non-formal learning contexts (Punie & Redecker, 2017). The structure of the DigCompEdu model is organised around three macro-areas (educators’ professional competences, educators’ pedagogic competences, learners’ competences), which comprise the following six different competence areas: a) professional engagement, b) digital resources, c) teaching and learning, d) assessment, e) learner empowerment, f) facilitating learners' digital competence.
The six competence areas, as previously outlined, comprise a total of 22 competences. Figure 1 provides a comprehensive overview of all the aforementioned elements pertaining to this competency framework.
Figure 1. Synthesis of the DigCompEdu Framework – Source: Joint Research Center (JRC)
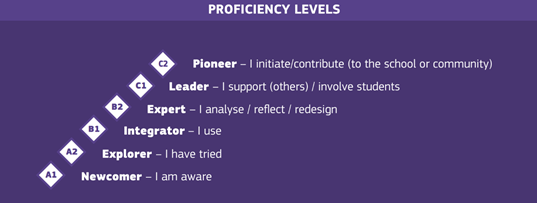
Its main purpose is, through their self-assessment, to allow teachers to discover both their strengths and weaknesses, setting different levels of development for each competency included in the DigCompEdu framework. These competence stages are aligned with the six proficiency levels as defined by the Common European Framework of Reference for Languages (CEFR). They range from A1 to C2 and can be summarized as presented in figure 2.
Figure 2 proficiency levels - Source: SELFIEforTEACHERS tool infographics, 2021.
METHODS
This descriptive research can be classified as an ex post facto study. In this type of study, the researcher is limited to report what has happened or is currently occurring (Hernández et al. 2014). Consequently, cannot control or modify any variables, actions or behaviors that have already occurred. In more specific terms, this study employs a cross-sectional research design with a descriptive approach and hypothesis testing. It involves the participation of teachers from all specialties that teach in both primary and secondary education from different regions of Greece in accordance with the European Union’s DigCompEdu framework.
OBJECTIVES
The research objectives are defined as follows:
• To determine the degree of digital teaching competence (TDC) of teachers from different geographical regions of Greece according to the DigCompEdu framework.
• To examine whether there are differences in digital teaching competences (TDC) between teachers based on the administrative region in which they teach.
• To analyze whether teachers’ TDCs differed according to their main teaching specialty.
• To analyze whether teachers’ TDCs differed according to the level of education (primary and secondary) they teach.
• To examine whether and to what extent teachers' TDC is influenced by a range of variables, including gender, age, teaching experience, years of ICT use, time spent using ICT in the classroom and their overall ICT technological proficiency.
Sample
This study employs a cross-sectional design, sampling 1,420 teachers from across Greece who teach in both primary and secondary schools. The participants are representative of all educational specializations, and the data collection occurred throughout the 2023-24 school year. The division of Greece into regions was based on the current administrative division of the country into the following regions: Eastern Macedonia and Thrace, Central Macedonia, Western Macedonia, Epirus, Thessaly, Ionian Islands, Western Greece, Central Greece, Attica, Peloponnese, North Aegean, Aegean and Crete. The quantitative approach was considered the most appropriate for its implementation, especially the survey research, due to its reliance on the collection of data from a representative sample of a population at a specific point in time. This allows for the generation of quantitative data on multiple variables for purposes such as comparative study and correlation of findings with those of previous empirical studies.
The results indicate that the sample comprises 1022 (72%) women and 392 (28%) men, representing a total of 1420 participants. Having 44.9% (f=638) between 50-59 years, 32% (f=454) between 40-49 years, 13% (f=184) between 30-39 years, 7% (f=100) over 60 years, 2.7% (f=38) 25-29 years. Of these, 54,9% (f=780) had a master’s degree, 32.6% (f=514) university degree and 8.9% (f=126) a doctorate.
Table 1 provides an overview of the number of teachers from each regional area of Greece who responded to the questionnaire.
Table 1. Frequency and percentage of teachers by region. Source: Own elaboration.
|
Region |
Frequency |
Precent |
|
Eastern Macedonia and Thrace |
110 |
7.7 |
|
Central Macedonia |
294 |
20.7 |
|
Western Macedonia |
42 |
3.0 |
|
Epirus |
82 |
5.8 |
|
Thessaly |
94 |
6.6 |
|
Ionian Islands |
38 |
2.7 |
|
Western Greece |
114 |
8.0 |
|
Central Greece |
84 |
5.9 |
|
Attica |
278 |
19.6 |
|
Peloponnese |
98 |
6.9 |
|
North Aegean |
22 |
1.5 |
|
South Aegean |
60 |
4.2 |
|
Crete |
104 |
7.3 |
|
Total |
1420 |
100.0 |
With regard to the years of teaching experience in education, Table 2 presents the frequencies and percentages achieved. The 20,4% of teachers (f = 290) have taught for 21–25 years, while a similar percentage 20.1%, (f = 286) have taught for between 16–20 years. The teachers with 1–5 years of experience was 16.8% (f = 238), while 13.4% (f = 190) have taught for between 26–30 years. Also, the data indicates that 10% (f = 142) of teachers have been in the profession for over 30 years, 8.7% (f = 124) between 6-10 years, 6.6% (f = 94) between 11-15 years and 3.9% (f = 56) for over 36 years.
Table 2. Frequency and percentage of years of experience as a teacher. Source: Own elaboration.
|
Years |
Frequency |
Precent |
|
1-5 years |
238 |
16.8 |
|
6-10 years |
124 |
8.7 |
|
11-15 years |
94 |
6.6 |
|
21-25 years |
286 |
20.1 |
|
26-30 years |
290 |
20.4 |
|
31-35 years |
142 |
13.4 |
|
36 years and more |
56 |
3.9 |
|
Total |
1420 |
100.0 |
Regarding how many years teachers have been using new technologies in their teaching practice, we have the following results: 31.4% (f = 446) 4-10 years, 23.8% (f = 338) 15 and more, 18% (f = 256) 1-3 years, 17.6% (f = 250) 11-15 years, 5.4% (f = 76) less than one year, 3.2% (f = 46) have not used even. Table 3 shows the numbers.
Table 3. Years of using ICT in teaching. Source: Own elaboration.
|
Years |
Frequency |
Precent |
|
I have not yet used digital technologies in my teaching |
46 |
3.2 |
|
Less than 1 year |
76 |
5.4 |
|
1-3 years |
256 |
18.0 |
|
4-10 years |
446 |
31.4 |
|
11-15 years |
250 |
17.6 |
|
15 years or more |
338 |
23.8 |
|
I prefer not to answer |
8 |
0.6 |
|
Total |
1420 |
100.0 |
Regarding the time of using ICT in the classroom, 346 teachers (24.4%) use ICT from 11 to 25 percent, 322 teachers (22.7%) use them from 26 to 50 percent, 258 teachers (18.2%) use ICT from 0 to 10 percent, 248 teachers (17.5%) use them from 51 to 75 percent and 246 teachers (17.3%) use them from 76 to 100 percent. Table 4 shows the results.
Table 4. Time of use of ICT in teaching (last three months). Source: Own elaboration.
|
Time |
Frequency |
Precent |
|
0-10% |
258 |
18.2 |
|
11-25% |
346 |
24.4 |
|
26-50% |
322 |
22.7 |
|
51-75% |
248 |
17.5 |
|
76-100% |
246 |
17.3 |
|
Total |
1420 |
100.0 |
Finally, in table 5, when asked whether they try out new digital technologies in their daily life, 38% (f = 540) agree, 33.9% (f = 482) agree completely, 17% (f = 242) I don't agree or disagree, 7% (f = 100) disagree and 3.9% (f = 56) completely disagree. The vast majority of the respondents 72.9% (f = 1022) agree or completely agree with it.
Table 5. Try out new digital technologies. Source: Own elaboration.
|
|
Frequency |
Precent |
|
I completely disagree |
56 |
3.9 |
|
I disagree |
100 |
7.0 |
|
I don't agree or disagree |
242 |
17.0 |
|
I agree |
540 |
38.0 |
|
I agree completely |
482 |
33.9 |
|
Total |
1420 |
100.0 |
INSTRUMENT
For the measurement and analysis of teachers' digital competences according to the European Framework for Digital Competence in Teaching (DigCompEdu), the Greek translation of DigCompEdu's Check-in self-assessment tool was used.
The DigCompEdu model is organised in the following three macro-areas: professional, pedagogical and students' digital competences. These consist of twenty-two items divided into 6 competency areas of the framework:
Professional engagement - organizational communication, professional collaboration, reflective practice and ongoing professional development through digital means.
Digital resources - selection, creation and modification, protection, managing and sharing.
Teaching and learning - teaching, guidance, collaborative learning and self-regulated learning.
Assessment - assessment strategies, learning analysis, feedback, planning and decision-making.
Empowering learners – personalization, accessibility and inclusion, active engagement of learners.
Facilitating learners’ digital competence - information and media literacy, communication, content creation, responsible use and problem solving.
There were seven response options in each question. Note that for each item there were seven response options on a scale of 0-6.
To measure the self-perception of the participants, at the beginning of the questionnaire, teachers are asked to rate their level of digital competence. After completing the questionnaire, they are asked again to describe their level of digital competence as teachers. They answer both questions according to the following classification, which is progressively increasing, as defined by DigCompEdu: Α1 : Newcomer (very little technological experience), A2 : Explorer (understands the possibilities offered by digital technologies and is interested in exploring them further), B1 : Integrator (experiments creatively with digital technologies integrating them into his teaching practice), B2 : Expert (Uses several digital educational technologies with confidence), C1 : Leader (Uses a plethora of digital technologies with consistent and coherent manner to enhance its pedagogical practice) , C2 : Pioneer (Seeks experimentation with innovative digital educational technologies and develops new pedagogical approaches.
Table 6. Reliability Statistics. Source: Own elaboration.
|
Cronbach's Alpha |
Cronbach's Alpha Based on Standardized Items |
N |
|
0.883 |
0.911 |
102 |
The reliability of the instrument both overall and across all dimensions is confirmed by the high levels of Cronbach's alpha and MacDonald's Omega (Table 7).
As can be observed, the highest reliability is observed in the Professional Engagement dimension with a reliability index >0.874 for Cronbach's Alpha, while for MacDonald's Omega the highest reliability is observed in Assessment >0.909.
Table 7. Total reliability index of the instrument and its different dimensions. Source: Own elaboration.
|
Dimensions |
Cronbach's Alpha |
MacDonald’s Omega |
|
A-Professional engagement |
.874 |
.706 |
|
B-Digital resources |
.859 |
.800 |
|
C-Teaching and learning |
.828 |
.894 |
|
D-Assessment |
.844 |
.909 |
|
E-Empowering learner’s |
.832 |
.893 |
|
F-Facilitating learner´s digital competence |
.842 |
.800 |
The instrument’s reliability index was analyzed in terms of the values achieved at the overall level and in its various dimensions.
RESULTS
The mean values and standard deviations for the overall sample and the overall instrument are presented in Table 7. Upon analysis of the total responses, the mean was 1.9159, while the standard deviation was found to be 1.10672.
A comparison of the dimensions’ reveals that the highest mean value occurs in “Digital resources” (2.02), while the lowest occurs in “Empowering learner´s” (1.73). With regard to the standard deviation, the highest deviation is observed in “Assessment” (1.79), while the lowest is observed in “Professional engagement” (0.84).
Table 8. Total reliability index of the instrument and its different dimensions. Source: Own elaboration.
|
Variables |
M. |
S.D. |
|
A-Professional Engagement |
1.872 |
0.84073 |
|
A1. Do you use digital technologies to enhance your communication with students, parents and colleagues? |
2.66 |
1.544 |
|
A2. How much consideration do you give to data management and ethical issues when using online learning environments (e.g. e-class, Moodle, Blogs, forms)? |
1.73 |
1.848 |
|
A3. Do you collaborate and interact with colleagues and/or other members of the educational community using digital technologies? |
1.90 |
1.482 |
|
A4. Do you use the digital technologies (devices, platforms and software) and infrastructure (internet access, local network) available in your school to enhance teaching? |
2.11 |
1.397 |
|
A5. Do you use digital technologies for self-examination and self-evaluation of your educational practices? |
2.31 |
2.353 |
|
A6. Is your digital activity considered to be governed by responsible and safe practices? |
1.93 |
1.542 |
|
A7. Do you use digital technologies for your continuous professional learning and improvement? |
2.08 |
1.322 |
|
A8. Do you participate in activities to improve the digital skills you use in your teaching (e.g. trainings, seminars, workshops, conferences on the use of digital technologies in teaching and learning)? |
1.84 |
1.456 |
|
A9. Do you engage in computational thinking activities and actions related to teachers' digital competence (e.g. problem analysis, find solutions by defining steps)? |
2.60 |
2.456 |
|
B-Digital resources |
2.02 |
1.134 |
|
B1. How would you describe the level of searching you do on the internet to find digital resources for your teaching? |
2.32 |
1.258 |
|
B2. Do you create your own digital content to support your teaching? |
2.05 |
1.580 |
|
B3. What is your level of competence in modifying existing digital resources to support your teaching, respecting copyright and licensing rules? |
1.95 |
1.871 |
|
B4. Do you organise and manage digital content to enable easy and secure access for students, parents and teachers, while protecting sensitive personal data? |
1.97 |
1.659 |
|
B5. Do you share digital content in a way that respects the rules on intellectual property rights and copyright rules? |
1.82 |
1.730 |
|
C-Teaching and learning |
1.94 |
1.422 |
|
C1. Do you use digital technologies to enhance learning outcomes by designing, developing, and supporting learning? |
1.99 |
1.516 |
|
C2. Do you use digital technologies in order to provide feedback and opportunities for reflection, leading to readjustment of teaching and learning practices for both teachers and students? |
1.74 |
1.842 |
|
C3. Do you use digital technologies to foster and enhance learner collaboration for individual and collective learning? |
1.79 |
1.898 |
|
C4. Do you use digital technologies to enhance students self-regulated learning processes, fostering active and autonomous learning making students more responsible for their own learning? |
1.98 |
2.144 |
|
C5. Do you use emerging technologies in ethical ways to explore novel learning experiences and content? |
2.19 |
2.416 |
|
D-Assessment |
1.95 |
1.796 |
|
D1. Do you use digital technologies to support formative and summative assessment of learning? |
1.81 |
1.881 |
|
D2. Do you use digital technologies to collect and analyse evidence on students learning processes and outcomes? |
1.98 |
2.181 |
|
D3. Do you use digital technologies to provide feedback to students? |
2.05 |
2.273 |
|
E-Empowering learner’s |
1.74 |
1.516 |
|
E1. Do you ensure access to digital resources for all your students, taking into account any cognitive or physical constraints to their use? |
1.61 |
2.024 |
|
E2. Do you use digital technologies to address diverse learning needs and capabilities, by allowing students to advance at different levels and speeds, and follow individual learning paths and objectives? |
1.77 |
2.113 |
|
E3. Do you use digital technologies to foster learners’ active and creative engagement in their learning? |
1.75 |
1.936 |
|
E4. Do you use digital resources and tools, online learning environments and platforms to ensure students' learning within and beyond the classroom? |
1.83 |
1.777 |
|
F-Facilitating learner´s digital competence |
1.97 |
1.607 |
|
F1. Do you incorporate learning activities in which students are required to use digital technologies to search, evaluate and manage information and data in digital environments? |
1.96 |
2.115 |
|
F2. Do you implement activities that require students to communicate and collaborate using digital technologies? |
1.74 |
1.980 |
|
F3. Do you incorporate learning activities that require students to express themselves by creating digital artefacts? |
1.95 |
1.946 |
|
F4. Do you empower students to use digital technologies safely, while mitigating risks to ensure physical, psychological and social well-being? |
2.03 |
2.213 |
|
F5. Do you empower students to use digital technologies responsibly and ethically, managing their digital identity digital footprint and digital reputation? |
2.19 |
2.323 |
|
F6. Do you incorporate learning activities where students use digital technologies to understand and solve problems? |
1.96 |
2.133 |
As previously stated, one of the primary objectives of the research was to ascertain whether there were differences between teachers in various regions of Greece. For this purpose, we formulated the following hypotheses, and the alpha error risk is set at 0.05.
H0 (Null Hypothesis): There are no differences between teachers from various regions of Greece in terms of their proficiency in the areas of the DigCompEdu framework.
H1 (Alternative Hypothesis): There are statistically significant differences between teachers from various regions of Greece in terms of their proficiency in the areas of the DigCompEdu framework.
Table 9 presents the means and standard deviations found in each of the DigCompEdu dimensions and for the entire instrument by region.
Table 9. Means and Standard Deviations for each of dimensions and for the total instrument by region. Source: Own elaboration.
|
Region |
|
A-Professional Engagement |
B-Digital resources |
C-Teaching and learning |
D-Assessment |
E-Empowering learner’s |
F-Facilitating learner´s digital competence |
|
|
Eastern Macedonia and Thrace |
M. |
1.7293 |
2.0327 |
1.8909 |
2.0909 |
2.1000 |
1.9727 |
|
|
S.D. |
.87858 |
1.20596 |
1.60358 |
1.8700 |
1.61458 |
1.63853 |
||
|
Central Macedonia |
M. |
1.7785 |
1.9279 |
1.8054 |
1.9320 |
1.5765 |
1.8900 |
|
|
S.D. |
.77618 |
1.05337 |
1.37435 |
1.85436 |
1.41077 |
1.62921 |
||
|
Western Macedonia |
M. |
2.1481 |
2.2762 |
2.0571 |
2.1270 |
1.7738 |
2.4048 |
|
|
S.D. |
0.81268 |
1.15944 |
1.42609 |
2.18761 |
1.56155 |
1.96760 |
||
|
Epirus |
M. |
1.9485 |
2.0098 |
1.8683 |
1.7398 |
1.6098 |
1.9350 |
|
|
S.D. |
.94800 |
1.08134 |
1.26695 |
1.61188 |
1.32410 |
1.47864 |
||
|
Thessaly |
M. |
2.1087 |
2.2255 |
1.787 |
1.9787 |
1.6809 |
1.8191 |
|
|
S.D. |
.66046 |
.96709 |
1.14590 |
1.42583 |
1.03006 |
1.12951 |
||
|
Ionian Islands |
M. |
2.0877 |
1.7684 |
2.0632 |
2.2807 |
1.9868 |
2.1316 |
|
|
S.D. |
1.10302 |
1.11261 |
1.38416 |
1.75791 |
1.45999 |
1.73947 |
||
|
Western Greece |
M. |
1.9591 |
1.9684 |
1.7825 |
1.5731 |
1.4956 |
1.5497 |
|
|
S.D. |
.92329 |
1.03994 |
1.29603 |
1.49828 |
1.37414 |
1.32963 |
||
|
Central Greece |
M. |
2.0132 |
2.2238 |
2.3762 |
2.3810 |
1.9881 |
2.3175 |
|
|
S.D. |
.91728 |
1.33187 |
1.48581 |
1.95747 |
1.69865 |
1.84355 |
||
|
Attica |
M. |
1.8777 |
2.0460 |
1.9583 |
1.9424 |
1.7266 |
2.1019 |
|
|
S.D. |
.81286 |
1.17969 |
1.51192 |
1.78190 |
1.61360 |
1.57287 |
||
|
Peloponnese |
M. |
1.5873 |
1.8776 |
1.8653 |
1.6599 |
1.5663 |
1.6088 |
|
|
S.D. |
.76980 |
1.08052 |
1.43096 |
1.82573 |
1.60923 |
1.55412 |
||
|
North Aegean |
M. |
1.8283 |
2.0909 |
2.2000 |
1.9394 |
2.0682 |
1.8030 |
|
|
S.D. |
.73120 |
1.18197 |
1.64693 |
1.90693 |
1.88380 |
1.48861 |
||
|
South Aegean |
M. |
1.8148 |
2.0333 |
1.9200 |
1.8667 |
1.3000 |
1.8278 |
|
|
S.D. |
.75572 |
1.14102 |
1.16165 |
1.55647 |
.98161 |
1.61879 |
||
|
Crete |
M. |
1.9103 |
2.0615 |
2.0846 |
2.1987 |
2.3221 |
2.4327 |
|
|
S.D. |
.87504 |
1.27075 |
1.57620 |
2.02919 |
1.78677 |
1.82138 |
||
|
Total |
M. |
1.8721 |
2.0237 |
1.9389 |
1.9493 |
1.7398 |
1.9718 |
|
|
S.D. |
.84073 |
1.13401 |
1.42164 |
1.79576 |
1.51635 |
1.60735 |
||
The following observations were made in the dimensions concerning the areas of the DigCompEdu framework by region: A-Professional engagement, the highest mean was observed in Western Macedonia (2,14). For C-Teaching and learning the highest mean was observed in Central Greece (2,37). In the area D-Assessment the highest mean is Central Greece (2,38). Finally, in area E-Empowering learner´s the highest mean was observed is Crete (2,32).
Subsequently, the Kruskal-Wallis non-parametric test was then applied to the years that teachers have been using ICT per dimension, resulting in the findings presented in Table 9.
Table 10. Years that teachers had been using ICT. Source: Own elaboration.
|
Dimensions |
H-Kruskal Wallis |
df |
Asymp. Sig. |
|
A-Professional engagement |
36.518 |
6 |
.000 |
|
B-Digital resources |
51.810 |
6 |
.000 |
|
C-Teaching and learning |
30.576 |
6 |
.000 |
|
D-Assessment |
13.393 |
6 |
.037 |
|
E-Empowering learner’s |
20.080 |
6 |
.003 |
|
F-Facilitating learner´s digital competence |
17.156 |
6 |
.009 |
The results of the Kruskal-Wallis’s test indicate that there is a statistically significant difference between the groups, with all values below the significance level (0.05). Therefore, we can reject the H0 Null Hypothesis that there is no statistically significant difference between teachers of different regions in Greece and years of experience in using ICT.
A rank test was then conducted to identify and analyse the possible differences between the regions of Greece in each of the dimensions of the framework.
Table 11. Rank test for the analysis of possible differences by region in the different areas of DigCompEdu. Source: Own elaboration.
|
Teaching Area |
N |
Average range |
|
Eastern Macedonia and Thrace |
110 |
33.444 |
|
Central Macedonia |
294 |
33.444 |
|
Western Macedonia |
42 |
31.244 |
|
Epirus |
82 |
34.511 |
|
Thessaly |
94 |
30.156 |
|
Ionian Islands |
38 |
31.022 |
|
Western Greece |
114 |
34.333 |
|
Central Greece |
84 |
35.333 |
|
Attica |
278 |
35.133 |
|
Peloponnese |
98 |
32.422 |
|
North Aegean |
22 |
27.900 |
|
South Aegean |
60 |
27.378 |
|
Crete |
104 |
32.556 |
As illustrated by the data presented in the table 10, the highest scores are observed in Central Greece, Attica, and Western Greece, while the lowest scores are found in South Aegean, North Aegean, and Thessaly.
We proceeded to perform the U Mann-Whitney and Wilcoxon signed-rank test in order to ascertain whether the mean values of our paired samples are statistically different. The paired samples are the different ages of the respondents in relation to all of the questions in the questionnaire. The analysis was carried out with a significance level of 0.05 and a confidence interval of 95.0%. The objective is to investigate the hypothesis that there is a difference between the gender of teachers in relation to the DigCompEdu framework.
H0 (Null Hypothesis): There is no difference between the gender of teachers of Greece in terms of their proficiency level in the areas of the DigCompEdu framework.
H1 (Alternative Hypothesis): There is statistically significant difference between the gender of teachers of Greece in terms of their proficiency level in the areas of the DigCompEdu framework.
Table 12. Wilcoxon’s W for the gender variable. Source: Own elaboration.
|
Dimensions |
U Mann-Whitney |
W Wilcoxon |
Z |
Sig. |
|
A-Professional engagement |
200188 |
722941 |
-0.018 |
0.86 |
|
B-Digital resources |
198266 |
721019 |
-0.298 |
0.766 |
|
C-Teaching and learning |
198760 |
721513 |
-0.226 |
0.821 |
|
D-Assessment |
190094 |
712847 |
-1.494 |
0.135 |
|
E-Empowering learner’s |
188626 |
711379 |
-1.704 |
0.088 |
|
F-Facilitating learner´s digital competence |
188764 |
711517 |
-1.682 |
0.093 |
The results presented in Table 12 lead to the rejection of the alternative hypothesis H1, indicating that there is no statistically significant difference between the paired samples (p-value > 0.05).
A rank test was then conducted to identify and analyse the possible difference between the gender of teachers of Greece in each of the dimensions of the framework. The results indicated that the overall score for females was higher than that of males, with an average rank of 711517.00 and 288888.00, respectively. In more specific terms, the two genders are situated at the same level for each dimension, with no discernible deviation.
We proceed with Kruskal-Wallis test to investigate the hypothesis whether there is a difference between the time use of ICT in the classroom according to the level of digital teaching competence (TDC) of teachers, with a significance level of p≤.05.
H0 (Null Hypothesis): There is no difference between the time use of ICT in the classroom according to the level of digital teaching competence (TDC) of teachers.
H1 (Alternative Hypothesis): There is statistically significant difference between the time use of ICT in the classroom according to the level of digital teaching competence (TDC) of teachers.
Table 13. In the last three months, what percentage of your teaching time have you used digital technologies in the classroom. Source: Own elaboration.
|
Dimensions |
H-Kruskal Wallis |
df |
Asymp. Sig. |
|
A-Professional engagement |
33.175 |
4 |
.000 |
|
B-Digital resources |
21.084 |
4 |
.000 |
|
C-Teaching and learning |
5.721 |
4 |
.221 |
|
D-Assessment |
8.984 |
4 |
.062 |
|
E-Empowering learner’s |
7.000 |
4 |
.136 |
|
F-Facilitating learner´s digital competence |
4.224 |
4 |
.376 |
The results permit the rejection of the null hypothesis (H0) for the areas A-Professional engagement and B-Digital resources, which states that there is no statistically significant difference of the teachers’ time spent using ICT in the classroom on their level of TDC. The findings indicate that the time spent by teachers using ICT in the classroom affects their specific areas of digital competence. The alternative hypothesis (H1) is rejected for the areas C-Teaching and learning, D-Assessment, E-Empowering learners and F-Facilitating learners’ digital competence.
A rank test was then conducted to identify and analyse the possible difference between the percentage of use digital technologies in the classroom. The results of this analysis are presented in Table 14.
Table 14. Average range test according of the time of use. Source: Own elaboration.
|
Time |
Average range |
|
0-10% |
35.333 |
|
11-25% |
33.178 |
|
26-50% |
32.622 |
|
51-75% |
31.244 |
|
76-100% |
33.644 |
The data does not allow for clear conclusions to be drawn regarding the use of ICT in the classroom and the highest level of TDC. The results indicate that the highest score was obtained by the least use of ICT in classroom (0-10%), while the second highest score was obtained by the highest duration of ICT use (76-100%).
A Kruskal-Wallis test was conducted to investigate the hypothesis whether is a difference in the level of TDC between primary and secondary school teachers, with a significance level of p≤.05.
H0 (Null Hypothesis): There is no difference in the level of TDC between primary and secondary school teachers.
H1 (Alternative Hypothesis): There is statistically significant difference in the level of TDC between primary and secondary school teachers.
Table 15. Kruskal-Wallis test for primary and secondary school teachers for their level of TDC. Source: Own elaboration.
|
Dimensions |
H-Kruskal Wallis |
df |
Asymp. Sig. |
|
A-Professional engagement |
20.449 |
4 |
.000 |
|
B-Digital resources |
20.277 |
4 |
.000 |
|
C-Teaching and learning |
17.287 |
4 |
.002 |
|
D-Assessment |
11.426 |
4 |
.022 |
|
E-Empowering learner’s |
11.114 |
4 |
.025 |
|
F-Facilitating learner´s digital competence |
9.043 |
4 |
.060 |
The results presented in Table 14 permit the rejection of the null hypothesis (H0), which states that there are no statistically significant differences between primary and secondary education in areas 1, 2, 3, 4, and 5. Consequently, between primary and secondary education there is significant difference in the level of digital competence of teachers in almost all areas of the DigCompEdu framework, with the exception of the area of "Facilitating learners' digital competence”.
Table 16. Average range test for primary and secondary school teachers for their level of TDC. Source: Own elaboration.
|
|
Average range |
|
Primary School with 6 classes aged 6-12 years (ISCED 1) |
739.090 |
|
Secondary - High School with 3 classes aged 12-15 years (ISCED 2) |
711.640 |
|
Secondary - High school with 3 classes aged 15-18 years (ISCED 2) |
705.220 |
|
Vocational Education - Vocational High School with 3 classes aged 15-18 years (ISCED 2) |
569.380 |
|
Secondary - Art and Music High Schools |
772.630 |
We have applied a rank test which shows that respondents working in Art and Music Secondary High Schools have the highest score with an average rank of 772.63, while respondents working in Vocational Education - Vocational High School with 3 classes aged 15-18 (ISCED 2) have the lowest score of 569.38. All of the above is shown in Table 16.
Finally, a Kruskal-Wallis test was performed to investigate the hypothesis whether there is a difference between teachers' specialties, with a significance level of p≤.05.
H0 (Null Hypothesis): There is no difference in the level of TDC between teachers' specialties.
H1 (Alternative Hypothesis): There is statistically significant difference in the level of TDC between teachers' specialties.
Table 17. Kruskal-Wallis test for teachers' specialties for the level of TDC. Source: Own elaboration.
|
Dimensions |
H-Kruskal Wallis |
df |
Asymp. Sig. |
|
A-Professional engagement |
89.067 |
27 |
.000 |
|
B-Digital resources |
51.247 |
27 |
.003 |
|
C-Teaching and learning |
54.355 |
27 |
.001 |
|
D-Assessment |
51.479 |
27 |
.003 |
|
E-Empowering learner’s |
46.446 |
27 |
.011 |
|
F-Facilitating learner´s digital competence |
42.612 |
27 |
.029 |
The above table shows that the H of the Kruskal-Wallis test has a p-value of less than 0.05 and therefore we can conclude that there is a statistically significant difference in the mean values of the variables under consideration for all dimensions. Therefore, we reject the Null Hypothesis.
Table 18. Teaching specialty. Source: Own elaboration.
|
Specialty |
N |
Average range |
|
Teacher (PE70) |
316 |
722.870 |
|
Theologian (PE01) |
46 |
791.590 |
|
Philologist (PE02) |
238 |
648.480 |
|
Mathematician (PE03) |
80 |
771.300 |
|
Physics (PE04.01) |
62 |
657.110 |
|
Chemist (PE04.02) |
22 |
738.770 |
|
Biologist (PE04.04) |
26 |
728.420 |
|
Geologist (PE04.05) |
12 |
761.330 |
|
French Philology (PE05) |
40 |
808.650 |
|
English Philology (PE06) |
122 |
761.550 |
|
German Philology (PE07) |
24 |
791.300 |
|
Fine Arts (PE08) |
14 |
891.500 |
|
Physical Education (PE11) |
48 |
757.670 |
|
Psychologist (PE23) |
6 |
318.830 |
|
Social Sciences (PE78) |
20 |
747.900 |
|
Musical Science (PE79) |
30 |
781.230 |
|
Economics (PE80) |
32 |
673.810 |
|
Civil Engineering - Architects (PE81) |
16 |
529.130 |
|
Mechanical Engineers (PE82) |
6 |
604.320 |
|
Electrical Engineering (PE83) |
4 |
672.880 |
|
Electronics Engineering (PE84) |
126 |
270.170 |
|
Chemical Engineering (PE85) |
28 |
159.000 |
|
Computer Science (PE86) |
18 |
736.360 |
|
Health - Welfare - Wellbeing (PE87) |
8 |
605.570 |
|
Agriculture, Nutrition and Environment (PE88) |
6 |
570.390 |
|
Applied Arts (PE89) |
32 |
435.250 |
|
Theater Education (PE91) |
|
556.830 |
|
|
824.440 |
As shown in Table 18, teachers of " Fine Arts", " Special Education " and " French Philology " have the highest TDC scores in all areas of the framework, while those in the fields of "Chemical Engineering," "Electronics Engineering," and "Psychologist" exhibit the lowest levels of digital competency.
DISCUSSIONS/CONCLUSIONS
Regarding the validity and the reliability of the instrument of the DigCompEdu framework to diagnose the TDC of teachers, we observe that the instrument exhibits excellent internal consistency, as indicated by the Cronbach's alpha and Mc Donald’s Omega values.
Also, this result is similar and in line both with those found in other European studies (Cabero-Almenara et al. 2020; Lucas et al. 2021; Barzabal et al. 2022; Marín & Sampedro, 2023) and with the results of a survey by the authors of the European Digital Competence Framework for Educators which involved 335 teachers in Germany (Ghomi & Redecker, 2019).
In conclusion, it is evident that this instrument is suitable for measuring the digital competence of teachers as it has high reliability rates both as a whole and in its different dimensions.
In the present study, an analysis was conducted on the gender of teachers involved. The results indicated that although the majority of respondents were women, there was no significant difference between them and men in terms of digital competence across all areas of DigCompEdu framework. A similar gender-based findings was reported by Fernandez-Cruz and Fernandez-Diaz (2016) and Gallego-Arufat et al. (2019). In addition, the studies concerning the digital teaching competence of teachers in Greece by Nou (2020), Vassilakis (2021), Iordanidis (2023) and Petromelidis (2023) found no differentiation in the findings between men and women. In contrast, there are surveys such as those of Casillas et al. (2017), Guillén-Gámez et al. (2021), Zhao et al. (2021), Pérez-Calderón et al. (2021), and Tzafilkou et al (2023) which demonstrate statistically significant differences either in certain sections or that women have a lower level of digital competence than men. The difference in the number of respondents between men and women was expected as according to the data of the Hellenic Statistical Authority [ELSTAT] (2021a), [ELSTAT] (2021b) and [ELSTAT] (2021c) which indicated that women teachers outnumber men in both primary and secondary education.
A further analysis of the research results indicated that the level of teaching digital competence (TDC) of teachers in different geographical areas of Greece varies significantly according to the DigCompEdu framework. In more specific terms, it was observed that the highest scores were obtained in Attica and central Greece, while the lowest scores were obtained in regions such as the North and South Aegean islands.
In regard to the analysis of the results pertaining to the potential differences in digital competencies among teachers according to their primary teaching specialties, the findings indicate that the majority of teachers’ specializations demonstrate a high level of digital competence, with the highest levels being achieved by teachers of Fine Arts, Special Education and French Literature. The results of a recent survey of teachers in Greece revealed that the specialties of Special Education and Fine Arts once again occupied the top two positions in digital teaching competence (Tzafilkou et al, 2023). The lowest scores were obtained by teachers with specialties in Chemical Engineering, Electronics Engineering who teach in vocational high schools and Psychologists. The majority of teachers with a specialty belonging in the sciences exhibited high levels of digital proficiency, which is in alignment with the findings of other studies (Fernandez-Cruz & Fernandez-Diaz, 2016; Ghomi & Redecker, 2019). However, in the present study, the scores of theoretical sciences such as French Philology, Theology and German Philology are higher than those of sciences which contradicts the results of the aforementioned studies.
The timing of this survey, conducted during the 2023-24 academic year, may have influenced the results. This was a period following the end of the Covid-19 pandemic and the transition to distance learning. It is possible that this led to higher scores from teachers in all areas of DigCompEdu compared to earlier surveys. The necessity of immediate need and daily teaching at a distance with digital media may have acted as a fast-paced empirical training experience, contributing to teachers' increased familiarity with digital technologies in Greece (Perifanou et al, 2021).
In the comparative analysis of the levels of education across Greece (primary & secondary), the highest scores are obtained by teachers who teach in music and art schools in secondary education. This is closely followed by teachers (PE70) of primary education, who also achieve high scores which contrasts with previous surveys before the covid-19 era where primary teachers and especially teachers lagged significantly. Research by Tzafilkou et al. (2023) shows lower digital competence of primary teachers compared to those in secondary education, which is related to the specialization of teachers (PE70) who are the majority at the primary education. Regarding the level of digital competency of teachers teaching in primary education, their high scores indicate a clear improvement in their digital competency compared to surveys mainly in the pre-covid era. Furthermore, it is evident that vocational education teachers exhibit significantly lower scores in comparison to all other levels of education.
The results found that 67,8 % of the teaching staff had more than 16 years of experience. During the period of economic crisis in Greece, when there was a reduction in the number of teachers recruited, we observe that only 15.3% started teaching during this period. In contrast, the economic recovery of Greece and the policy of new teacher recruitment in the last five years is reflected in the high percentage of 16.8% who gained experience from 1 to 5 years.
It is noteworthy that the majority of teachers (76.9%) are between the ages of 40 and 59 years old. Moreover, only a small percentage of them (8.6%) have used ICT in their teaching practice for less than a year or not at all. Most respondents indicated that they have been utilizing ICT in their daily teaching practice for an extended period. We observe a uniform distribution in the percentage of time teachers have been using ICT in their daily teaching practice. This may be related to both their specialization and the subject area they must teach on a daily basis. Finally, only the 10.9% of respondents expressed a negative attitude towards the adoption of new technological applications in their daily lives. Conversely, 71.9% of respondents indicated a positive attitude to try out the new technologies.
The principal limitation of the present survey is that, as is the case with all similar surveys, it reflects the personal opinions of teachers regarding their digital competence, which they assess themselves. Consequently, it is not possible to assume that the respondents' actual digital teaching competence or the digital skills they possess in using equipment and individual digital tools are being objectively assessed.
Therefore, in order to objectively capture the actual skills of teachers and their digital teaching competence across all areas and sub-dimensions, future research should concentrate on the development of practical tests designed to assess teachers' ability to utilize available equipment and necessary applications. Furthermore, in future teacher training, the face-to-face assessment of teachers' digital competence should be an integral component of the entire process. The implementation of the aforementioned evaluation proposal is hindered by the necessity of specialized applications and equipment, the extensive time required for practical tests, and the reluctance of some educators to undergo evaluation due to concerns about privacy.
REFENCES
Barzabal, M. L. T., Gimeno, A. M., Martínez, A. J., & Rodríguez, J. M. H. (2022). La percepcióndel profesorado de la Universidad Pablo de Olavide sobre su Competencia Digital Docente. Revista De Medios Y Educación, 63, 35–64. https://doi.org/10.12795/pixelbit.91943
Basilotta-Gómez-Pablos, V., Matarranz, M., Casado-Aranda, LA. et al. Teachers’ digital competencies in higher education: a systematic literature review. International Journal of Educational Technology in Higher Education19, 8 (2022). https://doi.org/10.1186/s41239-021-00312-8
Cabero-Almenara, J., Barroso-Osuna, J., Gutiérrez-Castillo, J. J., & Palacios-Rodríguez, A. (2020). Validación del cuestionario de competencia digital para futuros maestros mediante ecuaciones estructurales. Bordón, 72(2), 45–63. https://doi.org/10.13042/Bordon.2020.73436
Casillas, S., Cabezas, M., Ibarra, M. S., & Rodríguez, G. (2017). Evaluation of digital competence from a gender perspective. In Proceedings of the 5th International Conference on Technological Ecosystems for Enhancing Multiculturality (TEEM 2017). Association for Computing Machinery, New York, USA, Article 25, 1–5. https://doi.org/10.1145/3144826.3145372
Cattaneo, A. A. P., Antonietti, C., & Rauseo, M. (2022). How digitalised are vocational teachers? Assessing digital competence in vocational education and looking at its underlying factors. Computers and Education, 176(March 2021), 104358. https://doi.org/10.1016/j.compedu.2021.104358
European Commission, Joint Research Centre, Economou, A. (2023). SELFIE for teachers: designing and developing a self-reflection tool for teachers’ digital competence, Publications Office of the European Union. https://data.europa.eu/doi/10.2760/561258
European Commission, Joint Research Centre, Redecker, C., & Punie, Y. (2017). European framework for the digital competence of educators: DigCompEdu. Publications Office. https://data.europa.eu/doi/10.2760/159770
Fernández-Cruz, F., & Fernández-Díaz, M. (2016). Generation Z’s teachers and their digital skills. [Los docentes de la generación Z y sus competencias digitales]. Comunicar, 46, 97-105. https://doi.org/10.3916/C46-2016-10
Ghomi, M., & Redecker, C. (2019). Digital Competence of Educators (DigCompEdu): Development and Evaluation of a Self-assessment Instrument for Teachers' Digital Competence. In Proceedings of the 11th International Conference on Computer Supported Education (Vol 1). CSEDU (pp.541-548). https://doi.org/10.5220/0007679005410548
Guillén-Gámez, F.D., Mayorga-Fernández, M.J., Bravo-Agapito, J., & Escribano-Ortiz, D. (2021) Analysis of Teachers’ Pedagogical Digital Competence: Identification of Factors Predicting Their Acquisition. Technology, Knowledge and Learning, 26, 481–498. https://doi.org/10.1007/s10758-019-09432-7
Hellenic Statistical Authority (2021a) Primary schools 06L. Teaching staff of secondary schools of all types with postgraduate or other additional studies by gender. https://www.statistics.gr/en/home/
Hellenic Statistical Authority (2021b) Secondary schools 04AL. Teaching staff of all types of secondary schools with a Master's degree or other additional studies by gender. https://www.statistics.gr/en/statistics/-/publication/SED25/-
Hellenic Statistical Authority (2021c) High schools 04AL. Teaching staff of all types of secondary schools with postgraduate or other additional studies by gender. https://epi.org.uk/publications-and-research/diversity-of-teachers/
Hernández, R., Fernández, C., & Baptista, P. (2014). Metodología de la investigación. McGraw-Hill.
Iordanidis, F. (2023). Investigation of Digital Educational Competency of Secondary Teachers of Mathematics in the Region of Western Macedonia. (Master's thesis, University of Western Macedonia). Retrieved from: https://dspace.uowm.gr/xmlui/handle/13456789/3854
López-Bouzas, N., & del Moral Pérez, M. E. (2022). Instrument supported by digital applications to diagnose the communicative competence of students with ASD: design and validation. Innoeduca. International Journal of Technology and Educational Innovation, 8(2), 83–96. https://doi.org/10.24310/innoeduca.2022.v8i2.14264
Lucas, M., Bem-Haja, P., Siddiq, F., Moreira, A., & Redecker, C. (2021). The relation between in-service teachers' digital competence and personal and contextual factors: What matters most? Computers & Education, 160, Article 104052. https://doi.org/10.1016/j.compedu.2020.104052
Marín, V., & Sampedro, B.E. (2023). Views of secondary education teachers on the use of mixed reality. Frontiers in Education. 7, https://doi.org/10.3389/feduc.2022.1035003
Nou, K. (2020). European Framework for Digital Competence of Teachers/ Educators: The case of self-assessment of digital competence of adult educators of Public Institutes of Vocational Training in Greece (Master thesis). Hellenic Open University, Patras, Greece. Open University of Athens, Greece. https://apothesis.eap.gr/handle/repo/47348
Pérez-Calderón, E., Prieto-Ballester, J. M., & Miguel-Barrado, V. (2021). Analysis of Digital Competence for Spanish Teachers at Pre-University Educational Key Stages during COVID-19. International Journal of Environmental Research and Public Health, 18(15), 8093. https://doi.org/10.3390/ijerph18158093
Perifanou, M., Economides, A. A., & Tzafilkou, K. (2021). Teachers’ Digital Skills Readiness During COVID-19 Pandemic. International Journal of Emerging Technologies in Learning (iJET), 16(08), pp. 238–251. https://doi.org/10.3991/ijet.v16i08.21011
Petromelidis, M. (2023). Investigation of digital competence of primary school teachers according to the European digital competence self-assessment framework. (Master's thesis, University of Western Macedonia). https://dspace.uowm.gr/xmlui/handle/123456789/4230
Riquelme-Plaza, I., Cabero-Almenara, J., & Marín-Díaz, V. (2022). Validación del cuestionario de Competencia Digital Docente en profesorado universitario chileno. Revista Electrónica Educare, 26(1), 1-15. https://doi.org/10.15359/ree.26-1.9
Şimşek, A. S., & Ateş, H. (2022). The extended technology acceptance model for Web 2.0 technologies in teaching. Innoeduca. International Journal of Technology and Educational Innovation, 8(2), 165–183. https://doi.org/10.24310/innoeduca.2022.v8i2.15413
Tzafilkou, K., Perifanou, M. & Economides, A.A. (2023). Assessing teachers’ digital competence in primary and secondary education: Applying a new instrument to integrate pedagogical and professional elements for digital education. Education and Information Technology, 28, 16017–16040.https://doi.org/10.1007/s10639-023-11848-9
Vasilakis, V. (2021). Digital competence of Secondary Vocational Education teachers and its relationship with their pedagogical beliefs. (Master's thesis, Hellenic Open University). Retrieved from: https://apothesis.eap.gr/handle/repo/54123
Zhao, Y., Pinto Lorente, A. M., Sánchez Gómez, M. C., & Zhao, L. (2021). The impact of gender and years of teaching experience on college teachers’ digital competence: An empirical study on teachers in Gansu agricultural university. Sustainability, 13(8), 4163. https://doi.org/10.3390/su13084163.
|
Contribución de los autores The authors contributed equally to the entire research. |
|
Financiación This study was not funded. |
|
Agradecimientos Not applicable. |
|
Conflicto de intereses The authors declare that they have no conflict of interest. |
Citación: Chondrogiannis, V., & Gutiérrez-Castillo, J.J. (2025). Teaching Digital Competence in Greece according to DigCompEdu Framework. EDMETIC, Revista de Educación Mediática y TIC, 14(1), art.6. https://doi.org/10.21071/edmetic.v14.i1.17616